Google Analytics is amazing. Yep. That’s right, the geek in me has finally admitted it! Google Analytics has some of the most interesting and insightful reports that present incredibly useful data, important for dissecting and analysing. We have found the 5 best and most insightful Google Analytics reports for SEO that you should be using, like yesterday (insert valley girl voice here). Google Analytics is a very powerful tool that should be harnessed for all of your marketing efforts, and not just SEO. So keep that in mind whilst we dive into the world of Google Analytics. Don’t worry, it won’t be a bumpy ride!
1. The Google Analytics Channels Report
The Google Analytics channels report is something of a god send from those geniuses at Google. The channels report contains default channel groupings that identify the exact medium of traffic to a website. These default channel groupings include:
- Direct
- Organic Search
- Referral
- Paid Search
- Other Advertising
- Social
- Display
To find this report go to:
Audience> Acquisition> Overview> All Traffic> Channels
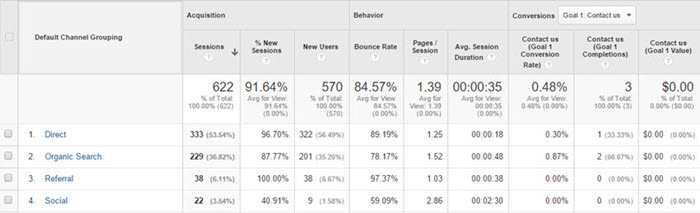
Why is this useful? The Google Analytics channels report is useful because it provides a top level view of the medium which drives the most traffic to a site. This can also assist in identifying the types of marketing strategies that perform better than others.
2. The Google Analytics Organic Landing Pages Report
The second Google Analytics report that is incredibly useful and insightful is the organic landing page report. Remember when Google decided that it would no longer show keyword performance? Well, the Landing Page report is the next best thing, as it provides you with the top performing organic landing pages. To find this report go to:
Audience> Acquisition> Overview> All Traffic> Channels> Organic Traffic> Landing Pages
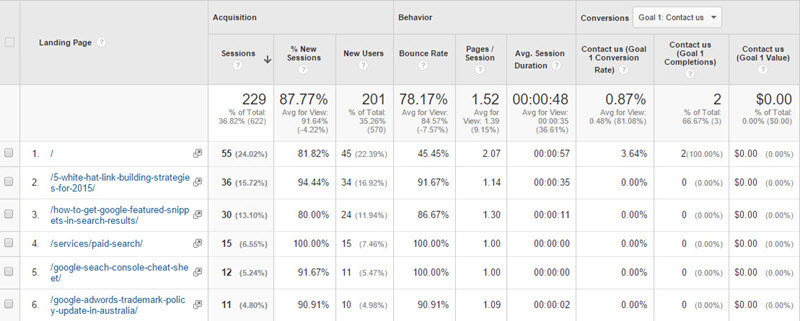
Why is this useful? Well the great thing about this report, is that it provides you with pages that receive the most sessions, whilst also identifying those pages that result in conversions or Goal completions. This means you can determine the amount a page is driving in revenue. This also means you can determine content topics that drive conversions, and harness this information for a future content strategy. Cool huh!
3. The Google Analytics Mobile Overview Report
Since the launch of Google’s Mobilegeddon, mobile friendly sites have become incredibly important, whilst also being a ranking factor for SEO. Basically, if your site isn’t mobile friendly or responsive it’s going to suffer. A recent study even discovered some sites disappearing from top Google results! The impact of mobilegeddon has also been more impactful than anticipated. So following this, you may want to consider looking into the Mobile Overview report in Google Analytics. This report provides you with an overview of the device category driving traffic to your site. It is broken down into 3 categories:
- Desktop
- Mobile
- Tablet
To view this report go to:
Audience> Mobile> Overview
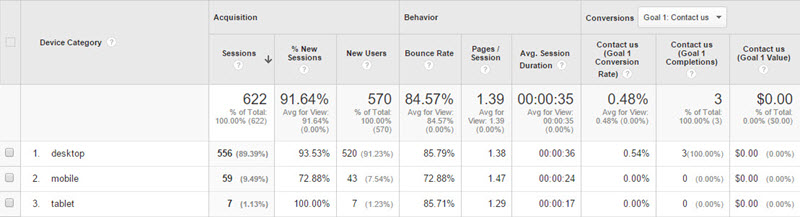
Why is this useful? This report is important as it provides an insight into the device category that drives the most traffic. Your site may drive far more mobile traffic than any other form of traffic. This means that a mobile friendly responsive site is essential, if you want your users to continue to return.
4. The Google Analytics Browser & OS Report
Ah yes, the Browser & OS report in Google Analytics is one of my favourites. If you are planning on redesigning your website, you might want to listen up! The Browser & OS report provides an overview of data by Browser, Operating System, Screen Resolution, Screen Colours, Flash Version and even Java Support! To view this report go to:
Audience>Technology> Browsers & OS
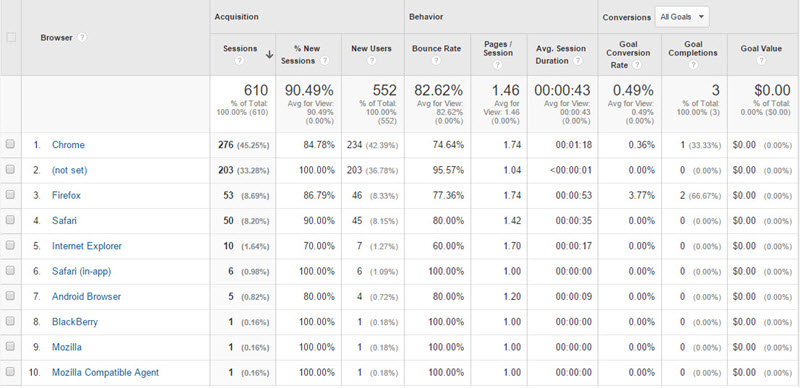
Now why is this report useful? Well this report can assist you in a range of areas such as building a new site, and understanding the technology you should be building your site for. Comparing conversion rates across platforms can assist you in identifying issues such as the inability to read flash without a computer installed program such as Adobe Flash Player.
When you are designing your new site you want to ensure it is compatible across browsers, operating systems and screen sizes and this report can help you identify the trouble areas on your current site, so you can avoid them on your new site! Search Engine Watch covers this extensively in their post how to use the Browser & OS Reports in Google Analytics.
5. The Google Analytics Ecommerce Product Performance Report
The ecommerce product performance report is one of the most insightful reports in Google Analytics! The product performance report provides you with an overview of data by product so you have an understanding of which products drive the most sales and revenue, whilst also highlighting those that do not.
To view the report go to:
Conversions> Ecommerce> Product Performance
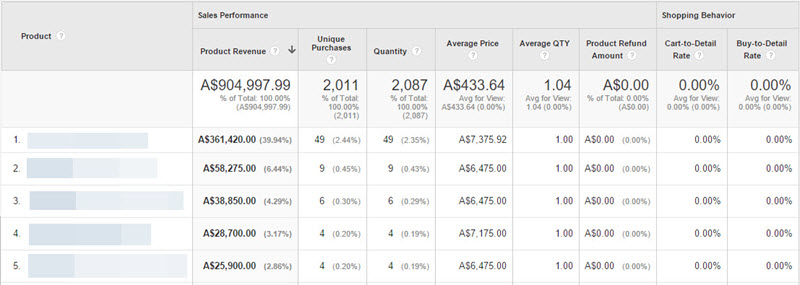
Why is this report useful? Now imagine you are the owner of a website that sells clothes, but certain products record absolutely no sales. Do you really want the issue of excess stock? The ecommerce product performance report will help you identify which products perform best so you can make the decision to restock, whilst identifying those that do not sell so you can avoid future excess stock issues. Basically, if you want to see your best sellers this is the report for you!
Bonus Tip: Add an organic segment to see which products perform best in regards to SEO. Go to: Add Segment> Organic Traffic> Apply.
Bonus Report: The Google Analytics Overview Report
I couldn’t help myself! I had to throw this useful report in as a bonus! The Google Analytics Goals overview report is a great way to identify which goals perform, and which do not in a single dashboard view. This report identifies all goal completion data such as number of goal completions, goal value, goal conversion rate and a breakdown of each goal and its stats. To view this report go to:
Conversions> Goals> Overview
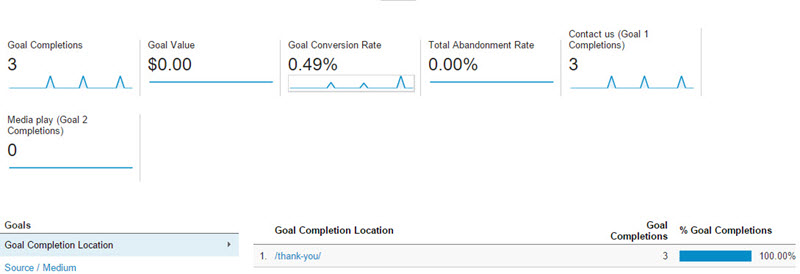
This report gives you a holistic view at your goal data, but what if you want to see Organic data? Well here’s a little bonus tip for you: Go to Add Segment> Organic Traffic> Apply
Why is this useful? This report gives you insights into how well you are converting your users, whilst identifying where a user is more likely to make a goal completion. You can also segment the report by ‘Goal Completion Location’, which can help you identify which products/services convert best and ‘Source/Medium’, which will help you identify which source/medium is more effective whether it be organic or direct etc.
We hope you found our list of the 5 best Google Analytics reports insightful and useful! If you’re interested in learning more about Google Analytics, why not have a read of our Google Analytics tips for better website tracking. If you would like assistance with your Google Analytics account, we’re always happy to help!